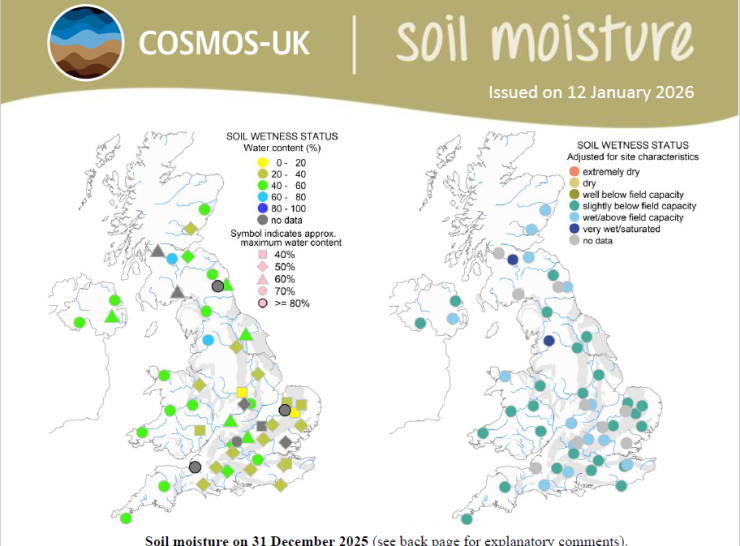
Each month, we produce a four-page summary of soil moisture across our network. This includes two maps showing daily mean soil moisture on the last day of the month. One graph shows wetness (as volumetric water content, VWC) of the soil which is constrained by soil type. The other map presents soil wetness adjusted for site specific characteristics, i.e. taking account of the possible range of soil wetness at each site. We also include graphs from a selection of our sites showing VWC compared to historical variability for the site and time of year.
Sign up to receive monthly soil moisture summary emails. You can unsubscribe from this list at any time.

